Saturday, May 23, 2009

Weekly Outlook for EURUSD


Attached is the weekly chart for EURUSD and lets analyse the weekly trend for EU and try to make some predictions for the upcoming week. Last week saw a one way movement in this pair. All previous resistances were broken, the retracements, if any, were very small and for short periods and the bullish uptrend was there for everyone to see.

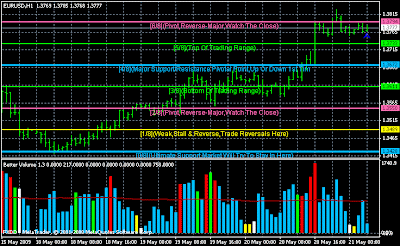
On the last day, EU broke thru a major psychological resistance at 1.4000. Ah!! Great thing. One more resistance down and off we go next week, thats what we think. But look closer. Look at the attached 1H chart and look at the price movements when the pair broke through a huge resistance and look at the volume. Is this how the break through a resistance is supposed to happen ?? Note the declining volume... When a major resistance is broken, you expect a long bar with high volume followed by some more high volume bars where other traders join in after the break of resistance, buy more and more and push the prices higher.

That does not seem to have happened here where the break of resistance has happened in low volume. The next 2 days will be crucial for this pair. I would expect a retracement in this pair for atleast 100 pips though the bullish trend is still intact. Support during the retracement would be there at 1.39 and then at around 1.3850. Holiday on Monday could throw a spanner in the works but i would favor a retracement before any more bullish move. It would be interesting to watch PA during the retracement to see if the retracement transforms into a correction or whether we see a continuation of the uptrend after retracement.

Updates on signal service

I have been quite busy with trading and attending to some personal work and hence have not been able to post any other stuff nor any updates on the signal service. Anyway, the first set of trials were over for the signal service and this trial was given to 67 people. As updated earlier, we had a bit of up and down first 2 days but the last 3 days were very good and we made more than 100 pips on each of those days.

Apart from this, there were 3 swing trade calls that were given which yielded a total of 400 pips. So overall the trial was good and then many of those on trial converted to the paid subscription. The first day of paid ones, i was quite busy as i had some personal work to catch up on. Hence, to compensate for the lack of signals, i had decided to extend the monthly paid service by a day. Yesterday, was a bit of a tough day cos the market was very quiet for most of the day but suddenly kept moving up against all expectations and hence it was a bit tough to manage.

We hope to have a great week ahead and i already have some possible trades lined up.

The trial would be a continuous thing and hence those who are interested can join up to try out the signal service for a week. Entries would always be open. Those who are interested can mail me at kartram.77@gmail.com .

This weekend, i would be a bit free and hence i will try and post some more articles..

Thursday, May 21, 2009

Daily Outlook for GBPUSD


Attached is the 1H chart for GBPUSD and like the EU, this train also seems to have no stopping. Considering the volatility of this pair, yesterday would have been a terrible day to trade. Lots of fake moves and unless you are a very good trader, the whipsaws would really have burnt your account. Shows what the professionals would do to get your money. We had a raise, then a huge dip, then again a raise. Woof!!

Anyway, as in EU, the hourly and daily charts dont show any major resistance and we again have to go to the weekly to see any kind of resistance. But for the past few hours, the price seems to be stalling around 1.5880 but considering the fact that the last few hours marked the end of the US session, that does not seem to be a great surprise. We should see London showing us the way.

On the upside, we should see 1.5885 acting as decent resistance and if that gives way, we should go all the way close to 1.6 which should prove as a very good psychological resistance.

On the downside, there is good support at 1.5870 and then at 1.5810 and then a strong support at 1.5750. As In EU, i would expect a retrace to close to 1.58 and then the PA there should tell us the future direction.

Daily Outlook for EURUSD


Attached is the 1H chart for EURUSD and so far, there seems to be no stopping this one way train. Even the retraces that take place are quite small showing how much strength is there in this pair. So where will it stop ?

Looking at the hourly charts, there does not seem to be any resistance in sight !! But 1.40 could prove to be a strong psychological resistance. Not because of any great previous resistance but just because its a round number. The daily charts also do not show any major resistances on the upside and we have to move to the weekly chart to find any resistances. Just shows you the power of the move so far. It would be interesting how this week ends up and that should give us an indication of the future direction.

On the upside, there should be some resistance close to 1.4 and if that manages to be broken succesfully, then the next resistance should be 1.4160.

On the downside, the support is at 1.39, then at 1.3875 and then at 1.38. Looking at how far it has gone up so far, i would expect a retrace in this pair to around 1.38 and the PA there should determine the next direction.

Wednesday, May 20, 2009

Daily Outlook for EURUSD


Attached is the 1H chart of EURUSD. As specified in my article yesterday and something that has been threatening to happen for the past couple of weeks, finally happened. EU finally managed to break through the major resistance at 1.3672. You can see the break happen in the big long bar. Thats how resistances are usually broken, in big long bars.

After the break, the price has gone up to the next resistance level at 1.3782 and is now resting near the same. There has not been much retracement after the break. This signals 2 possibilities. First one is that there might be a retracement into the high 1.36s and close to the broken resistance. Second possibility is that this lack of retracement shows great strength and hence higher prices. For this second possibility to come true, the previous high of 1.3815 needs to be broken. Till that time, we can safely short any approach towards 1.38.

On the downside, the supports are at 1.3750 and then at 1.3680 and i dont see 1.3680 being broken.

On the upside, the resistances are at 1.3815 and then at 1.3920. I expect a bit of retracement today followed by an upmove and dont expect the support at 1.3680 to be broken.

Tuesday, May 19, 2009

Daily Outlook for GBPUSD


Yesterday was a big day for GBPUSD. It managed to break a resistance which had been proving to be very strong over the past few weeks. Attached is the 1H chart for GU. The resistance was at around 1.5350 and it had not been broken for quite sometime. Now it has finally been broken, and the bigger thing was that it managed to hold up over the resistance for the whole day.

We had a small retrace towards the small support at 1.5442 and it was indeed surprising that it has not revisited the broken resistance at 1.5350 as it usually does.

Anyway, looking ahead, 1.5350 should serve as a strong support and 1.55 should serve as strong resistance. GU has been trying to break 1.55 for quite sometime now and i assume its only a matter of time before its broken. This resistance has psychological value to it more than anything else.

We could also have a small retrace before the big move to break 1.55. On the downside, the support are at 1.5442 and then at 1.5380 and then at 1.5350 and i dont see 1.5350 being broken today.

On the upside, 1.55 should serve as good resistance and then next resistance is at 1.5625. 1.55 should serve as huge resistance though.

Daily Outlook for EURUSD


Attached is the 1H chart of EURUSD. As expected, it made a good upmove yesterday but still it was not able to break the strong upper resistance at around 1.3672. Since the failure at 1.3672, it has retraced back and is no consolidating at lower levels.

There is an important news coming up later in the day which is the FOMC meeting minutes which is usually a big market mover. I believe that market would be waiting for the news during the day and hence i would not bet on any major moves before that. In fact, i would expect some more retraement before the news.

On the downside, there is strong support at 1.3611 and then at 1.3550 and i do not expect the price to fall much below these 2 support levels. We should see a lot of ranging between 1.3550 and 1.3672 during the course of the day.

On the upside, as pointed out, there should be strong resistance at around 1.3672 and i do not expect this to be broken during the early part of the day.

As for the overall direction for the day, there should be ranging and consolidation between 1.3550 and 1.3672. I would try and play the range between the SRs at 1.3550, 1.3611 and 1.3672 and breakout on either side of 1.3550 or 1.3672 would make me take the trade in that direction for a big ride. I would like to stick my neck out and say that today could be the day when 1.3672 is broken and we could see a large upside.

Monday, May 18, 2009

Daily Outlook for EURUSD


Attached is the 1H chart of EURUSD. As specified in my article yesterday, EU could not breach the lows of 1.3428 and did make a strong move towards 1.3500. The fact that it closed the day above 1.35 shows that there is lot of strength in this pair.

So, now unless the low of 1.3428 is broken, we should see EU moving up. The fact that it made a dip yesterday and then rose right back up shows that there has been good demand at the lower levels and we should be seeing much more upside in this pair. I believe that this pair should be reaching the previous highs that are close to 1.37 quite soon.

On the upside, EU should face resistance at 1.3580 and then at 1.3611. Break of this resistance should lead to the price moving towards 1.3672 where a huge resistance exists.

On the downside, the supports are at 1.3550 and then at 1.3520 and a strong support at 1.3490. I favor the upside for today. watch out for a retrace towards 1.35 though.

Sunday, May 17, 2009

Daily Outlook for GBPUSD


Attached is the 1H chart for GBPUSD. GBPUSD has been looking weak for the past few days along with EU and has visited its lows at around 1.5075 twice over the last few days. It now has major support at 1.5137 and then just below at 1.5075.

I believe that it will take some time for GU to break these 2 supports and we could see a retracement back into 1.52 and the price action there would tell us whether the pair would continue up or would start moving down once again.

On the downside, as pointed out, there would be strong supports at 1.5137 and then at 1.5075. A break of these supports would lead to a drop to the round number at 1.50.

On the upside, the targets are 1.5175 and then 1.5250. I expect a retracement back to 1.52 for today and then a break of 1.5250 will signal a further upmove and a coninuation of the uptrend... A break of 1.5075 will signal a down move.

Daily Outlook for EURUSD


Attached is the 1H chart of EURUSD. The fall from 1.37 continues and this shows that 1.37 has indeed proved to be a temporary and the 2 day bearish pin bar seems to have worked just fine.

EU is now close to a very strong temporary support at 1.3428 and this could be a place for small longs with tight SL the first time that it visits this price. With the strong support just below, i am looking for a small retracement back to the 1.35s and after that, it purely depends on the price action on whether it wants to continue up or go down.

As pointed out, on the downside, the support is at 1.3428 and the break of that could lead to 1.3380 and then to 1.33 which should again be a very strong support.

On the upside, the resistances are at 1.3460 and then at the round number at 1.35. A break of this could then lead to 1.3550 and at this point, it will be important to see if this resistance is broken convincingly. If yes, then we are going back up. If no, if are continuing down.

Market and the Frictionless Ball

All of you would have seen the supports and resistances which i provide to all on a daily basis. These S and R are points in which the price is expected to stall and also there is a greater probability of the price falling from the resistance than it breaking. Thats what make the S and R useful and powerful.

But the big mistake that many traders make is to follow the S and R blindly. When the price nears a support or a resistance, we need to analyse the market situation as well as the market sentiment before we decide whether we are going to enter into the trade or not.

The market is like the frictionless ball which keeps rolling in one direction unless and until acted upon by a force. Everyday, atleast 3 forces act on the ball (market). These are the begin of the Asian session, European session and the American session. Apart from these three forces, there could be other forces like news, press conferences, rate hikes etc. but everyday will have atleast 3 forces. Lets say that in the begin of the Asian session, the ball is rolling in favor of the longs. The Asian traders would either choose to slow down the ball or force it to travel in the same direction faster or force it to reverse. Whichever is the direction, the ball keeps rolling in that direction till the begin of the European session (unless there is some news in between. If there is news, then that would be another force which will make the ball gain momentum or change direction). Likewise, the European traders would also make the ball move in a specific direction (either same or reverse). This trend continues during the American session as well and would be interrupted only by news etc.

So when entering a trade based on S and R, it is important to know what time it is and which direction the ball is rolling. The best example would be a day when in the begin of the Asian session, the ball began to roll in the direction of the longs. This continued in the Euro session as well. So midway, through the Euro session it would be foolish to enter into a short just cos we have met a resistance. The ball is rolling in favor of longs from the Asian session and continues thru the Euro session and since there has been nothing to change that direction, it is expected to roll in that direction only till the next force (like the news or begin of American session) comes in. So in such cases, it is better to wait for the next force to come in to get the correct direction (whether the force continues the move in the same direction or reverses it) before entering in the market. For example, on the above day, it would not have been a great idea to enter into shorts at any time just cos a resistance was near.

So always keep in mind the frictionless ball and trade accordingly.